Running a Local LLM on a Fanless MacBook Air M5 — The Real Wall Is Memory, Not Heat
I ran this test because I can't stand heat. On a 32GB M5 MacBook Air (fanless), I set out to find a setup that runs a local LLM decently without heat — and measured it myself. To lead with the conclusion: the real wall wasn't heat. It was memory.
TL;DR
- Apple Silicon has no tool to cap the GPU clock directly. The only "throttle switch" macOS gives you is Low Power Mode.
- Turn Low Power Mode on and generation speed drops to about half (a 2.2× factor), but even on the fanless Air the heat stays perfectly flat. Turn it off and speed more than doubles — but as continuous load builds, a real throttling curve (up to −29% from peak) appears.
- What makes a big model unusable is memory, not heat. On the 32GB Air, a dense 27B (17GB) crashed to 2.7 tok/s; a post-mortem showed the cause wasn't swap but the memory-bandwidth ceiling (the model sits 100% on the GPU, yet every token still has to read 17GB), and swap was a symptom of the system running short on resources. Heat, in fact, was nowhere to be found — because the GPU sat idle waiting on memory.
- The takeaway formula: RAM sets the model size (a ~14GB file or under is the rule of thumb), and Low Power Mode handles the heat. The sweet spot is not a large dense model but a mid-size MoE. → In practice,
gpt-oss:20b(20B MoE, 13GB) ran at 29 tok/s, flat and heat-free, confirming the hypothesis. - But that Low Power switch is not an LLM-only lever — it's a whole-device switch. Turn it on and web/JS compute slows by 1.9× too, and the screen's frame rate is halved, 60→30fps. The cost bites hardest right at that frame rate, so at night, when no one is looking at the screen, that cost is zero (4-6).
First, just four terms (30 seconds)
Before the main argument, this is all you need.
- Parameters (B) — the model's "brain size." Bigger leaves more room to be smart, but eats that much more RAM and power.
- dense vs. MoE — a dense model uses the whole brain to produce a single word; a MoE (mixture of experts) wakes only the experts it needs each time. So even when its total size is large, the share actually doing the work (its active parameters) is small, which makes it fast and cool.
- Quantization (Q4 and so on) — compression that squeezes a model down to 1/3–1/4 of its size. Quality takes a small hit, but it's the key trick for running one on a laptop.
- tok/s — word-fragments produced per second. A person reads at roughly 5–10 tok/s, so around 20 is plenty for practical use.
1. Environment
| Item | Detail |
|---|---|
| Machine | MacBook Air (fanless), Apple M5, 32GB unified memory |
| OS | macOS 26.x (Darwin 25.5) |
| Runtime | Ollama 0.30.10 — a separate instance isolated from my main work (port 11435, project-local model store) |
| Instrumentation | Custom thermal logger (CSV at 5-second intervals) |
The logging harness was built only from metrics obtainable without sudo:
- Thermal state — Swift
ProcessInfo.thermalState(0 nominal / 1 fair / 2 serious / 3 critical). macOS's official read on thermal pressure. - Battery temperature — the Temperature field from
ioreg AppleSmartBattery. - Memory pressure & swap — from
sysctl.
Note: on this machine,
pmset -g thermdid not return a continuous throttle metric (CPU_Speed_Limit). Seeing GPU power (W) as well would requirepowermetrics(which needs sudo), but the metrics above were enough to capture the thermal trend.
2. The Problem
A fanless MacBook Air has no fan to vent heat. So running a workload that holds the GPU for a long stretch — like a local LLM — naturally raises three questions.
- Is there a way to control the heat? — macOS has no power-cap tool like NVIDIA's
nvidia-smi -pl. It turned out the only lever a user can touch on Apple Silicon is Low Power Mode (System Settings → Battery). Because it works by lowering the clock ceiling of the entire SoC, CPU and GPU get pressed down together. - How much does Low Power Mode actually do? How much speed do you give up, and how much heat do you buy back?
- Where is the model-size ceiling on the 32GB Air?
I measured this A/B.
3. Test Method
- Three models
lfm2.5:8b— MoE, ~1.5B active parameters (5.2GB file)qwen3:4b— dense 4B (2.5GB file)qwen3.6:27b— dense 27B, Q4-quantized (17GB file) ← for the memory-ceiling test- Load — per model, 3+ minutes of continuous generation with no pause, 800 tokens at a time, logging generation speed (tok/s) each round
- A/B — run with Low Power Mode ON and OFF separately
- Safety cutoff — after each round, check thermal state and battery temperature; auto-abort on
criticalor battery above 40°C (which never once triggered in practice)
4. Test Results
4-1. Low Power Mode ON vs. OFF — Speed
| Model | Low Power ON | Low Power OFF | Factor |
|---|---|---|---|
lfm2.5:8b (MoE) | 41.4 tok/s | 89.5 tok/s | 2.16× |
qwen3:4b (dense) | 17.9 tok/s | 38.8 tok/s\* | 2.17× |
\* For qwen3:4b OFF, the pre-throttle flat stretch runs at 42.5 tok/s (2.37×); the overall average, including the later throttled stretch, is 38.8. See 4-2 below.
Low Power Mode pressed speed down to just over half. With a clock cap in place, that's as expected.
4-2. Low Power Mode ON vs. OFF — Heat
| Low Power ON | Low Power OFF | |
|---|---|---|
| Thermal state | nominal (0) throughout | enters fair (1) (from 161s of load, 49% of samples) |
| Speed curve (1st model, lfm) | perfectly flat | 97 peak → wobbling between 80–97 (up to −18%) |
| Speed curve (2nd model, qwen) | perfectly flat | 42.5 flat → monotonic decline to 30.0 (−29%) |
| Battery temperature | ~30.1°C | 30.4 → 31.1°C |
With Low Power ON, speed stayed flat the whole way. The clock is pressed below the thermal limit from the start, so throttling never gets the chance to kick in. With it OFF, as load accumulated the thermal state rose to fair, and the 2nd model (qwen3:4b) — which ran after heat had built up — drew a pronounced throttling curve, declining monotonically to −29% from peak (still falling at the end of the test — run it longer and it would have dropped further). Even that throttled floor (30.0 tok/s) is 1.7× faster than the Low Power ON average (17.9). And it never went near critical, and the battery stopped at 31°C. It's distinctly warm to the touch, but nowhere near a dangerous level for the hardware.
Why you needn't worry about damage: throttling is itself the protection. The chip lowers its own clock before it reaches a dangerous temperature, and if that isn't enough it forces a sleep. Worst case, it just slows down — it doesn't break.
4-3. The Memory-Ceiling Test — dense 27B (17GB)
At the memory ceiling, the picture changed completely.
| Metric | Result |
|---|---|
| Generation speed | 2.7 tok/s (about 5 minutes for 800 tokens) |
| Memory pressure | normal (1) → warning (2) |
| Swap | 0 → about 675MB appears |
| Thermal state | nominal (0) throughout, battery 30.2 → 30.4°C |
The 17GB model plus its KV cache squeezed against the 32GB ceiling and pushed things into swap. The cause of the crash to 2.7 tok/s was not heat but a memory bottleneck. Prompt-processing speed was also about 1/70 that of the small models. Because the GPU sat idle waiting on memory, heat was in fact nowhere to be found. A "cool because it's slow" state.
A post-mortem dug further into the cause. Reloaded, the model sat 100% on the GPU. It wasn't slow because "part of it spilled over to the CPU" — bandwidth itself was the bottleneck. Turning Low Power off and re-measuring gave 6.6 tok/s, exactly 2.4× the Low Power ON figure (2.7). That matches the small models' clock-cap factor (2.2–2.4×). Whether swap was 675MB or 3.1GB, the speed held to this same factor. The 27B's slowness was the product of "the memory-bandwidth ceiling of having to read 17GB of weights per token × the Low Power clock cap." Swap was a symptom, not a cause. Among the suspects that could produce the slowdown (thermals, swap, clock cap, bandwidth), thermals and swap were, in effect, acquitted by measurement.
The real crux is not the file-size number itself. It's whether the model and its KV cache both fit inside the RAM Metal hands to the GPU (about 21GB of the 32GB). The 27B overflowed that, and the moment it overflows, every token has to re-read all the weights, so memory bandwidth decides the speed.
In other words, on this Air a dense 27B is in "it runs, but you can't use it" territory (6.6 tok/s even with Low Power off). And this problem is not solved by Low Power Mode or heat management — because the bottleneck is memory bandwidth, not the clock.
4-4. A Side Finding — MoE vs. dense
lfm2.5:8b (8B parameters) has twice the parameters of qwen3:4b (4B parameters), yet ran 2.3× faster. Because it's a MoE, only ~1.5B active parameters switch on per token, so it does less compute. It's the textbook case of "low spec, high output" on a fanless Air, and the most favorable structure on both heat and speed.

Only two are rowing, yet the boat throws up spray and moves at its own pace — the MoE way of waking just a few experts. (AI-generated illustration)
4-5. Verifying the "Usable Ceiling" — gpt-oss:20b (MoE, 13GB file)
I directly tested the hypothesis the earlier results had set up ("the sweet spot is not a large dense model but a mid-size MoE that fits into RAM with room to spare"). gpt-oss:20b is a 20B MoE (~3.6B active parameters), and at 13GB it fits into 32GB of RAM with room to spare. (Low Power OFF — directly comparable to the OFF figures in 4-1.)
| Metric | Result |
|---|---|
| Generation speed | 29.4 tok/s (28.9–29.9, perfectly flat) |
| Prompt processing | 537 tok/s |
| Memory pressure | holds at normal (1) (unlike the 27B, the model fits entirely in RAM) |
| Thermal state | fair (1) at most, battery 30.6°C |
The hypothesis held exactly. Even as a 20B model, its small active-parameter count delivered 29 tok/s (several times reading speed); the speed was flat across the full 3 minutes and the heat was negligible. It stands in stark contrast to the dense 27B, which under the same Low Power OFF condition managed 6.6 tok/s because of the memory bottleneck. Its parameter count is larger, at 20B, but thanks to two conditions — "it actually fits in RAM, and its active parameters are small" — it's 4.5× faster under identical conditions (29.4 vs. 6.6).
4-6. Low Power Mode Was Not an LLM Switch
So far, I've treated Low Power Mode purely as a speed knob for the LLM. But that switch isn't mounted next to the LLM. It's in System Settings → Battery, and pressing it presses down the entire SoC (Section 2). That means the browser, documents, and the screen all get pressed down too — and the preceding sections didn't measure that cost. So the next day, on the same machine, I dropped the LLM and re-ran the A/B on everyday tasks alone.
Measurement conditions — a single continuous session on 2026-07-19. On battery power throughout (no charger connected), with Low Power ON/OFF verified by pmset at every measurement. The browser was Safari.
Two compute benchmarks slow by 1.9×.
| Measurement | Low Power ON | Low Power OFF | Factor |
|---|---|---|---|
| Speedometer 3.1 (web responsiveness) | 24.3 | 47.5 | 1.95× |
| JetStream 2.2 (pure JS compute) | 324.5 | 623.2 | 1.92× |
| 5 document tasks (median) | — | — | 1.58×\* |
\* Pages PDF export (65 pages · 325 pages), Numbers CSV open (20,000 rows · 60,000 rows), Numbers app launch. Median of 3 runs each, range 1.29–1.87×. The same files were reused for both ON and OFF to remove file-difference as a variable. Among the app-launch items, Pages was an unexplained outlier far removed from everything else, and Keynote's OFF measurement failed, so each was dropped.
Two benchmarks of entirely different character converged at 1.95 and 1.92. Document tasks slowed less than that because they mix in stretches unrelated to CPU speed, like disk reads and app loading. Taking document tasks on their own, speed loses only 1.58×, while power differs by the 1.87× that comes up later — so the electricity to finish the same job is about 15% less on the Low Power side. In this stretch alone, it's a net gain.
These numbers did not measure the LLM. They're web benchmarks, document tasks, and the screen. Don't read them as "Low Power slows the LLM by 1.9×." This is as far as the claim goes. The 2.16× and 2.17× measured on the LLM in 4-1, and the 1.92–1.95× measured on wholly unrelated workloads, landed in a similar place. That isn't proof of the same cause — it's the observation that two separate measurements both came out at "just over half."
The real cost is paid elsewhere — the frame rate.
| Measurement method | Low Power ON | Low Power OFF |
|---|---|---|
Custom frame counter (requestAnimationFrame, 5s) | 30.2 fps | 60 fps |
| MotionMark benchmark's auto-detection | 30fps | 60fps |
The display hardware is 60Hz in both cases. The refresh rate didn't drop — the browser is given only half as many chances to draw the screen. Two measurements based on entirely different principles gave the same answer, so it's hard to write off as a measurement error.
This machine is 2880×1864, fixed 60Hz, no ProMotion. A ProMotion Mac (120Hz) has a separate effect where the refresh rate itself drops to 60Hz in Low Power Mode, so this 30fps finding shouldn't be carried over to it as-is.
Only MotionMark's frame-rate detection was used. Its score can't be compared directly, since the target frame rate differs between ON and OFF.
Why this bites more than the 1.9× on compute. Compute can halve in speed and you won't notice if the task is short. The PDF export went from 0.93s to 1.19s. A 0.26s difference is imperceptible without a stopwatch. Halving the frame rate, by contrast, shows up in a single scroll. You don't feel the benchmark score; you feel the scroll. When people say things "got noticeably slow" with Low Power on, this is usually what they're feeling.
Power is close to a 1:1 trade.
| Low Power ON | Low Power OFF | |
|---|---|---|
| Average power draw | 9.43 W | 17.63 W (1.87×) |
| Full-charge equivalent runtime | about 7.7 hours | about 4.0 hours |
You trade the compute benchmarks' 1.9× for power's 1.87×. As long as the work is wholly tied to CPU speed, Low Power Mode is not a device that does the same work more thriftily — it's a device that does less work per second. It leaves the total unchanged and spreads that total thinner to last longer.
Power was estimated by logging remaining battery charge (mAh) at 15-second intervals and running a linear regression. The ON stretch was 27.4 minutes and the OFF stretch 13.3 minutes, so task composition and length aren't perfectly identical (a difference in idle fraction) — trust the direction, but treat the factor as an approximation.
And there was no heat on either side. The thermal state was nominal across all samples — 110 on Low Power ON, 54 on OFF — and the battery-temperature change was +0.1°C and +0.8°C. That includes an 8-minute continuous run of a GPU benchmark. The very machine that climbed to fair in 4-2 after just over 3 minutes of LLM load doesn't warm up on web browsing and document editing. Anyone who turns on Low Power out of concern for heat is, at least for everyday work, putting out a fire that was never lit.
For reference, this machine's web responsiveness with Low Power on (24.3) falls short of the M2 Air (41.9, magiclasso.co 3-run average) on one axis of Speedometer and overlaps the M1 Air range (26.4–26.7). One switch sets you back some four or five years, but coming back takes a single click. Note that the M1 figures are forum self-reports, so even among M1 Airs they scatter widely, 18.5–26.7. It's "similar on one axis of a benchmark," not that the machine becomes an M1 — the memory bandwidth, the screen, and the media engine are all still current.
So what about running a batch job like illustration generation at night on Low Power?
If you have something to run overnight, leaving Low Power on looks like the thrifty choice. The data doesn't support that intuition — though that data came from web and document tasks. On the compute benchmarks, performance and power sat almost 1:1, and if that 1:1 carries over to image generation as well, the electricity per 100 jobs is about the same either way. In that case Low Power ON doesn't save electricity — it spends twice the time.
I should explain the caveat I just hedged with. I never measured image generation with Low Power off. There's only a record of 66 seconds per image with it on; neither the off side nor its power draw is in this data. That the factor changes when the workload changes is exactly what I just confirmed above with compute's 1.9× and documents' 1.58×. I can't just let that pass without flagging it. And anyone who sleeps with the charger plugged in has no reason to conserve battery in the first place.
And yet the conclusion is half right. Only the reason differs. The costliest thing about Low Power was not compute but the halved frame rate — the visible smoothness. And at night no one is looking at that screen. The cost is zero. Night is not the time you should turn Low Power on; it's the one time of day when on or off makes no difference at all.
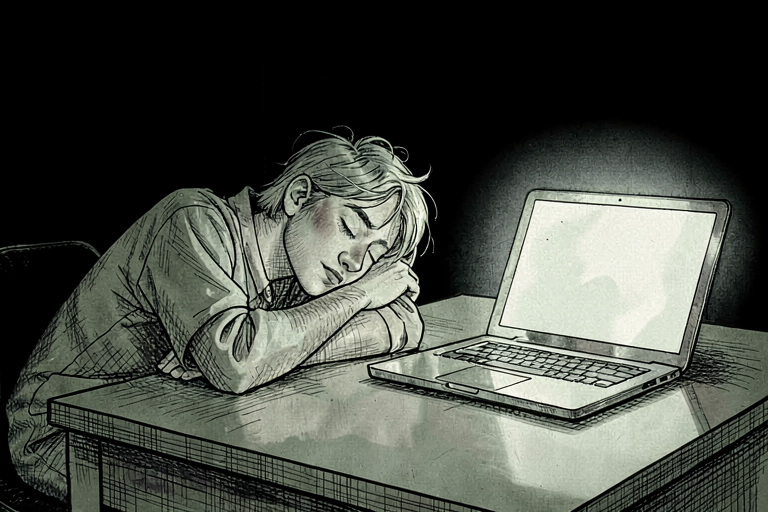
Even in the hours no one is watching, the screen stays lit. (AI-generated illustration)
There's one honest gap to flag here. The throttling curve in 4-2 (−29% from peak, still falling at the end of the measurement) is based on just over 3 minutes of load. What curve eight hours of continuous load would draw isn't in this data. It remains possible that the off-side, run overnight, gets pressed down by throttling until it ends up close to the on-side. So I can't go as far as "for a nightly batch, off is better." Measuring it would mean actually staying up all night, and this test wasn't that diligent.
"With a gap this large, should I give up on the LLM?" You've picked the wrong thing to give up. The conclusion of 4-3 and 4-5 — the wall is RAM and the sweet spot is a mid-size MoE — stands regardless of Low Power, and Low Power never touches that wall to begin with. The rational reasons to turn Low Power on narrow to one: when you need the battery you have left to last longer.
Full Comparison (at Low Power OFF)
| Model | Structure | File size | Generation speed | Bottleneck |
|---|---|---|---|---|
lfm2.5:8b | MoE (~1.5B active) | 5.2GB | 89.5 tok/s | none |
qwen3:4b | dense 4B | 2.5GB | 38.8 tok/s | late-stage thermal throttle (−29%) |
**gpt-oss:20b** | MoE (~3.6B active) | 13GB | 29.4 tok/s | none (sweet spot) |
qwen3.6:27b | dense 27B | 17GB | 2.7 tok/s\* | memory |
\* The 27B figure is a Low Power ON measurement. In the post-mortem, OFF was 6.6 tok/s (applying the same 2.4× clock-cap factor) — either way the verdict of "not usable" is the same.
5. Summary
The local-LLM formula for the 32GB fanless Air that came out of these measurements:
RAM sets the model size (a file of ~14GB or under is the recommendation), and Low Power Mode handles the heat.
That "~14GB" is only a rough line for convenience; there's no measured threshold yet. The real crux is whether the model and its KV cache fit inside the Metal working set (about 21GB of the 32GB), and that line shifts along with context length or quantization.
- Low Power Mode is a heat/speed lever. With a small or MoE model, even Low Power ON delivers 40 tok/s, so "usable without heat" holds.
- But that lever doesn't apply to the LLM alone. The moment you flip it, the whole device is pressed down with it: web compute slows by 1.9×, and above all the screen's frame rate is halved from 60fps to 30fps (4-6). The cost is paid outside the LLM.
- But Low Power Mode is powerless against the memory bottleneck. What makes a big model usable is not Low Power but choosing "a size that fits into RAM with room to spare."
- So the practical ceiling is not a large dense model but a mid-size MoE (a model with few active parameters).
If on-device AI is the shift that moves inference cost from a cloud subscription to the price of the silicon in your own hands (On-Device AI: Cost and Jurisdiction, Not Chips, Draw the Line), then this piece is a record of measuring, on one machine, the wall that silicon actually runs into.
Practical Recommendations
If you're running a local LLM on this machine (M5 / 32GB fanless Air):
- Everyday sweet spot — a mid-size MoE like
gpt-oss:20b. Plenty fast at 29 tok/s, with room to spare on both heat and memory. The balance point of quality and speed. - Top speed — a small MoE like
lfm2.5:8b. 90 tok/s. Light and fast. - What to avoid — dense 20B+ (like the 27B). Once it exceeds RAM and gets pushed outside the Metal working set, you get nowhere.
- If heat concerns you when running an LLM for a long stretch — Low Power Mode ON. Speed halves, but all the models above still hold above reading speed (a small MoE stays in the 40 tok/s range), and the heat goes completely flat. But this prescription is for continuous LLM load only. For web browsing or document editing, there's no heat to begin with, even with Low Power off (4-6). And turning it on has you pay a cost alongside — it's not just the LLM that quiets down; the whole device throttles back with it, and the screen's frame rate drops to 30fps.
- For a batch run at night — on or off, either works. It's the time slot when no one is watching the screen, so Low Power's biggest cost disappears. On electricity, the compute benchmarks came out at performance:power of 1:1, so if that carries over to image generation, nothing is saved and only the time doubles — though I never measured image generation with Low Power off. If forced to pick, plug in the charger and leave it off — and I didn't measure overnight continuous load either (see the limits below).
The Limits of These Measurements
Don't over-trust these results. Most were measured just once (n=1) (the 27B got only one round), and GPU power (W) needs a sudo tool, so it went unmeasured this time. On top of that, the models were run in sequence, so a later model started on a chassis the earlier one had already warmed (order confound). So a between-model comparison like "A throttles more easily than B" can't be drawn from this data. gpt-oss started from a cooled state after a 28-minute rest, and "flat" is based on 3.5 minutes of load, so a curve might appear if run longer. Swap, too, lingers once it appears, so a later test captures only the increment. "Load in the 3-minute range · this model set · this machine" is the extent of what this piece guarantees.
The Low Power measurement appended at the end (4-6) has one more limit. It measured web, documents, and the screen — not the LLM — and even its longest stretch is under 30 minutes. How Low Power ON and OFF diverge under eight hours of continuous load — the real answer for a nightly batch — is not in this data. Measuring it would mean staying up all night, and I didn't.
Sources
- Raw data:
thermal-logs/*.csv(per-round tok/s + thermal/memory logs at 5-second intervals) - Load and thermal instrumentation harness (the core of this piece):
thermal_logger.sh(thermal/memory CSV logger),heat_test.py(continuous-load driver, with safety cutoff),run_heat_test.sh(wrapper) - Extended measurement harness from the same session:
datamart_bench.py(SQL accuracy),drawthings_test.py(image generation),concurrent_test.py(LLM + diffusion concurrently) - All tests ran on a separate Ollama instance (port 11435) isolated from my main work.
- Low Power Mode A/B extended measurement (4-6 · single session, 2026-07-19): Speedometer 3.1 · JetStream 2.2 (Safari), MotionMark (frame-rate detection only), AppleScript-automated document tasks (median of 3 each, same files reused),
requestAnimationFrameframe counter (5s), and power estimated by logging remaining battery charge (mAh) at 15-second intervals and running a linear regression. On battery power throughout, with Low Power state verified bypmsetat every measurement.
- Low Power Mode = an SoC-wide clock cap and the only user lever — Apple support documentation + Eclectic Light Co measurements (M4 Pro).
- Metal GPU working-set RAM ~65–75% (32GB → about 21GB) — Apple Tech Talk "Metal Compute on MacBook Pro" (10580) + developer-community measurements.
- Global benchmark score tables — each vendor's official model cards and aggregation sites (note: heterogeneous sources · MMLU ≠ MMLU-Pro · benchmark ≠ practical use).
- Active parameters cross-checked against official cards — HuggingFace official model cards (LiquidAI/LFM2.5-8B-A1B, openai/gpt-oss-20b).
- Generational-comparison Speedometer reference figures (4-6 footnote) — M2 Air 15" (41.9), magiclasso.co 3-run average, 2026-01-08 / M1 Air (26.4–26.7), MacRumors forum self-reports. Benchmark and Safari versions differ, so for loose reference only.